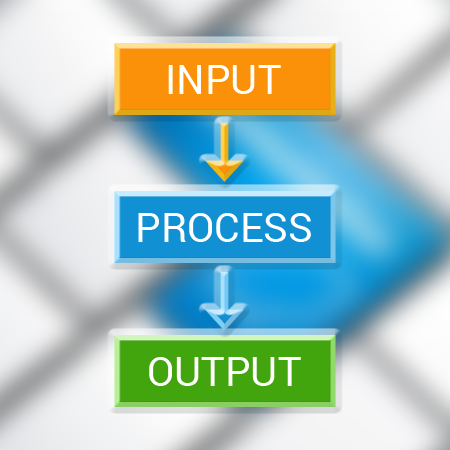


IPO model can be simply explained as an input-output process in which input is received from a user or source and certain processing is carried on input to provide necessary output. The main essence of this complete system lies in the processing environment that calibrates in input in order to find the desired output. There are two main categories in which work is divided into as follows.
IPO (input output system) is quite susceptible to misinterpretation as well because in theories, it has all the required data with regard to environment in system and may contain different types of objects that may not be possible for system to understand. As a result of this, it is important for the data which is required to be interpreted must be having defined boundaries of input and output variables that need to be processed. This enables the system to work within a defined understanding and also able to comprehend where it needs to limit. Therefore, when it comes to statistical analysis of IPO model, we often see analysts defined set of boundaries in order to create a defined system for analysis.
IPO model could be defined as a functional graph that shows input and output required and what all processes are required in order to obtain required output from input. This model may include specific type of storage unit as well which helps in transformation of data. The data is flow into the input unit from the outside and processing of data is carried out in order to transform the data. Output unit shows the required data flow process and result of transformation procedure. An example of an IPO model is explained below.
HR firm is having issues with their hiring process as various engineers hired in the firm are not retained for a long time. This causes more cost to firm since hiring and training of new junior engineers could be costly and time consuming process. Therefore, the engineering firm is required to create an IPO model of its hiring process and in this model they try to resolve the issues related to hiring.
IPO model is useful to show the inter dependencies of various sectors and commonly used in economics to evaluate the impact of inter-industry matrix entries.
Advertisement: